#7281
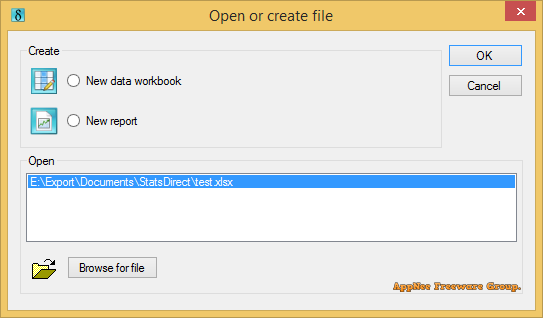
StatsDirect is a comprehensive statistical software applicaton to provide users with a wide array of tools for data analysis and visualization. It is designed for researchers, statisticians, and professionals across various fields, including healthcare, social sciences, and engineering to uncover patterns and underlying trends of extensive datasets.
Loading...
Loading...
Loading...
Loading...
Loading...
Loading...
#7220
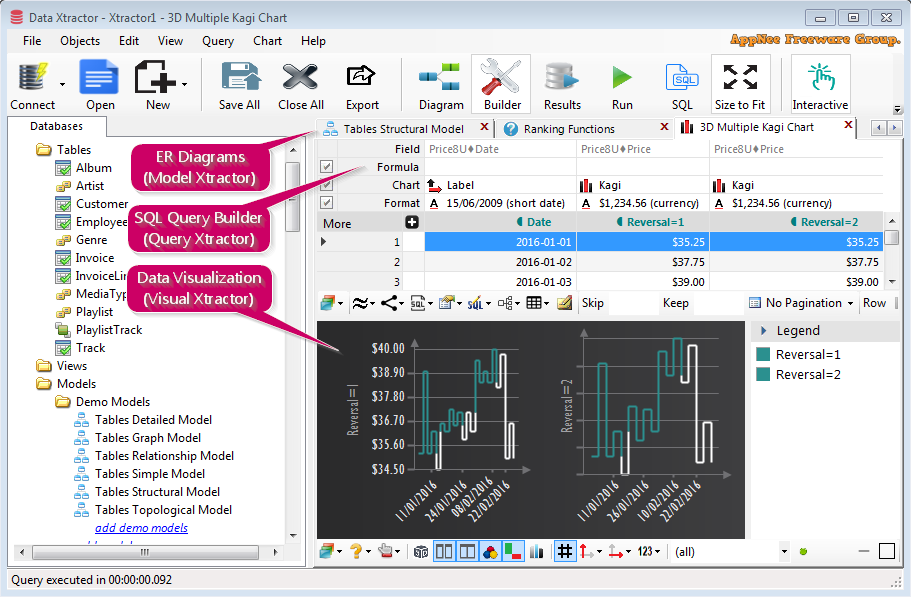
Data Xtractor is an all-in-one database solution that allows you to leverage the capabilities of both Model Xtractor and Query Xtractor from the same developer XtractPro Software simultaneously. This comprehensive suite includes all modules and features from its specialized variants.
Loading...
Loading...
Loading...
Loading...
Loading...
Loading...
#7095
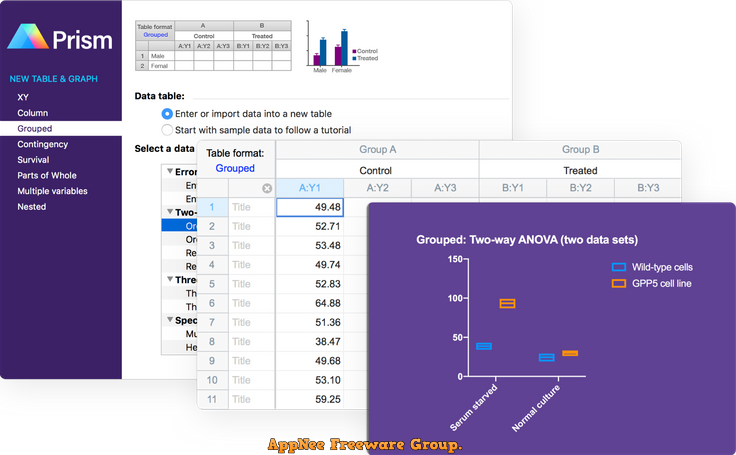
GraphPad Prism is a powerful software suite that includes an extensive range of biostatistical features aimed at helping biologists and researchers analyze intricate data sets and create clear, informative graphs. It's widely used in the fields of biomedical research, pharmacology, and any discipline that relies on complex data analysis and visualization.
Loading...
Loading...
Loading...
Loading...
Loading...
Loading...
#7041
When it comes to presenting scientific data visually, utilizing plots, charts, maps, and various other representations is essential. The depth of information and insights that can be drawn from imagery is remarkable, making it crucial to have an effective tool for creating such visualizations. This is where tools like Surfer enters the scene.
Loading...
Loading...
Loading...
Loading...
Loading...
#7037
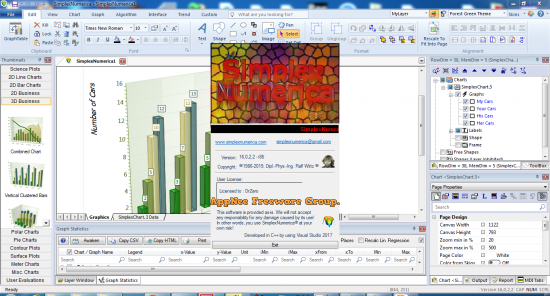
SimplexNumerica is a robust and feature-rich tool designed for numerical calculations, mathematical modeling and simulation, developed by Dipl.-Phys.-Ing. Ralf Wirtz from Germany. It is especially favored by professionals in fields such as engineering, physics, and finance because of its versatility and user-friendly interface.
Loading...
Loading...
Loading...
Loading...
Loading...
#6963
Grapher is a powerful graphing program designed to meet the needs of scientists, engineers, and data analysts who require high-quality visual representations of their data. With intuitive user interface, Grapher allows users to easily create a wide variety of graph types, including line graphs, scatter plots, bar charts, and 3D surface plots, among many others.
Loading...
Loading...
Loading...
Loading...
Loading...
#6843

e!Sankey is a powerful, customizable, and easy-to-use Sankey diagram tool designed to visualize complex data flows and relationships, developed by iPoint-systems from Germany. With its intuitive drag-and-drop interface, users can quickly create sophisticated Sankey diagrams without any coding knowledge.
Loading...
Loading...
Loading...
Loading...
Loading...
Loading...
Loading...
#6350
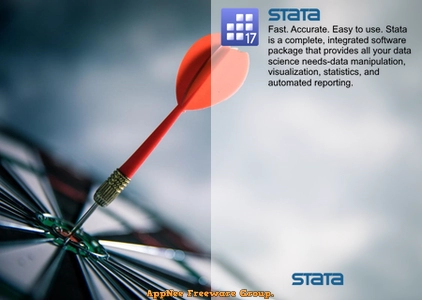
Stata is an integrated statistical software that integrates data analysis, data management and professional charts drawing features in one place. It is mainly used for data manipulation, visualization, statistics, and automated reporting by researchers in many fields, including biomedicine, economics, epidemiology, and sociology.
Loading...
Loading...
Loading...
Loading...
Loading...
Loading...
#6276
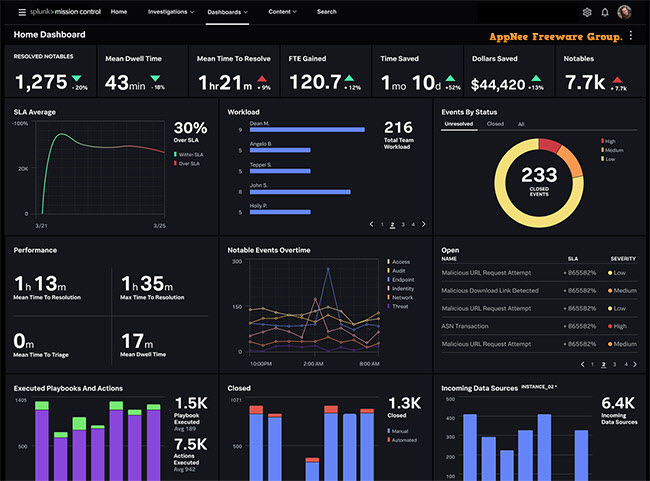
Splunk is a top-level distributed data computing platform for Windows, Mac and Linux platforms. It can process various logs or machine data generated by any system, software or device, and provides operations such as real-time data collection, storage, indexing, searching, correlation, visualization, analysis, and reporting in a wide range of scenarios, so as to transform big data into actions and values of the enterprise.
Loading...
Loading...
Loading...
Loading...
#6019
We may have to deal with a large amount of CSV, XLXS and other table data in our daily work. However, there are many disadvantages of using traditional CSV editing tools or importing it into database for operations. For example, complex operations cannot be executed through scripts; with low efficiency and high cost; once the operation is wrong, it is very difficult or even impossible to undo the operation; once there is a problem, it is difficult to find out where the problem starts; not WYSIWYG... Hence, that's where we got this edge tool - Easy Data Transform.
Loading...
Loading...
Loading...
Loading...
Loading...
Loading...