When it comes to presenting scientific data visually, utilizing plots, charts, maps, and various other representations is essential. The depth of information and insights that can be drawn from imagery is remarkable, making it crucial to have an effective tool for creating such visualizations. This is where tools like Surfer enters the scene.
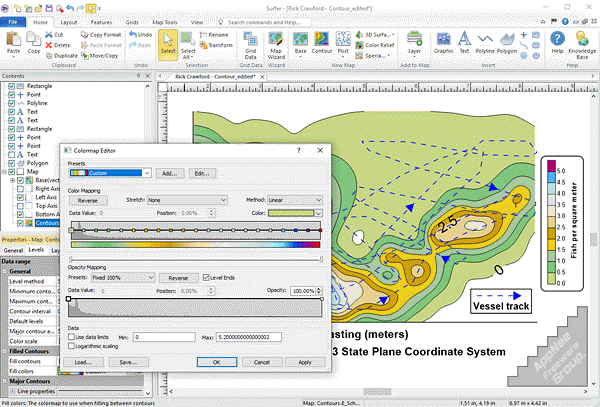
Developed as a robust application for both 2D and 3D visualization, Surfer enables users to effortlessly plot and analyze data from diverse sources for various purposes. With an academic background in geography and a focus on cartography, Surfer's design offers a highly accessible and importantly adaptable workflow in skilled hands. You can easily create striking graphical plots, maps, and a variety of cartographic products, while also fine-tuning their attributes in detail, thanks to the thoughtfully curated set of design features.
Surfer approaches data representation design meticulously, and its tab-based layout further highlights this. Undoubtedly, the tools and features it provides create a solid foundation for producing a wide array of data presentations. The functionality available in Surfer far exceeds that of a basic application. Moreover, it can effectively manage even straightforward designs, delivering efficient workflows along with detailed customization and analysis of the data entered.
In short, if you're in search of an app that can adeptly handle spatial and various other types of data, and generate graphical representations such as plots and cartographic outputs, Surfer - with its comprehensive approach - is undoubtedly one of the right choices for you.
Key Features
| Feature | Description |
| Ensure Accuracy | Adjust interpolation and gridding parameters to ensure accuracy and increase confidence in the interpolated dataset. Include variogram models, define faults and breaklines, or generate grid statistics to identify trends or anomalies. |
| Robust Interpolation | Transform regularly or irregularly spaced data onto a grid or raster with 13 different interpolation methods including Kriging, Inverse Distance to a Power, and Triangulation with Linear Interpolation. |
| Eliminate Uncertainty | Bring subsurface characteristics to light with cross sections or profile maps or explore the data from every angle in Surfer’s 3D view as you fly between drillhole paths and inspect all aspects of isosurfaces and volumes. |
| Reveal Insights | Apply mathematical operations on grid files, including “matrix math” operations. Generate isopach or isochore maps, calculate contamination volumes, identify anomalies, model groundwater flow and solute transports, or calculate slope and aspect. |
| Enhanced Visuals | Visualize grids using 10+ different map types such as contours or surfaces, and combine the data with other layers like aerial photographs, spot locations, drillhole data and LiDAR point clouds. |
| True 3D | Level up your model with true 3D interpolation and many more unique features. Add point locations, surfaces, drillhole paths and data, and 3D XYZC grids as rendered volumes or isosurfaces in true 3D space. |
| Enhance Maps & Models | Add title blocks, company logos, legends, scale bars, cross sections, magnifiers, or multiple axes. Add context with imagery that’s imported or downloaded from online servers directly within Surfer. |
| Share Your Work | Copy and paste directly into PowerPoint or Word, export all of some map layers to DXF for AutoCAD, provide the field crew with a KMZ file to view the model in Google Earth, or export to PDF, 3D PDF, or TIF for your final report. |
| Bridge the Gap | Help investors fully conceptualize the extent of the project by walking them through the site in 3D all from the comfort of the boardroom. Highlight areas of interest, pinpoint the source of contamination, and clarify the full extent of the remediation efforts. |
| Full Control | Take advantage of complete control over all gridding parameters, including options to incorporate anisotropy, faults, breaklines, and variogram models. |
| Complete Compatibility | Import and export numerous file formats like SHP, DXF, PDF, GeoTIFF, and XLSX, georeference images, and effortlessly manage unreferenced data and data in different and multiple coordinate systems. |
| New Insights | Incorporate old data into your model with Surfer’s georeferencing and digitizing tools and the option to generate grid or raster files directly from contour maps. |
Edition Statement
AppNee provides the Surfer Edition multilingual full installers and unlocked files, as well as portable full registered versions for Windows 32-bit and 64-bit.Installation Notes
for v28.1 on Windows:- Download and install Surfer
- Copy the unlocked file to installation folder and overwrite
- Done
Related Links
Download URLs
| Version | Download | Size |
| v28.1 |  |
210 MB |