GraphPad Prism is a powerful software suite that includes an extensive range of biostatistical features aimed at helping biologists and researchers analyze intricate data sets and create clear, informative graphs. It's widely used in the fields of biomedical research, pharmacology, and any discipline that relies on complex data analysis and visualization.
GraphPad Prism boasts an intuitive interface and well-structured documentation that provides valuable tips and techniques suitable for users of all experience levels, from novices to experts. You can begin your work by opening an existing file or starting anew with a template from one of the available projects.
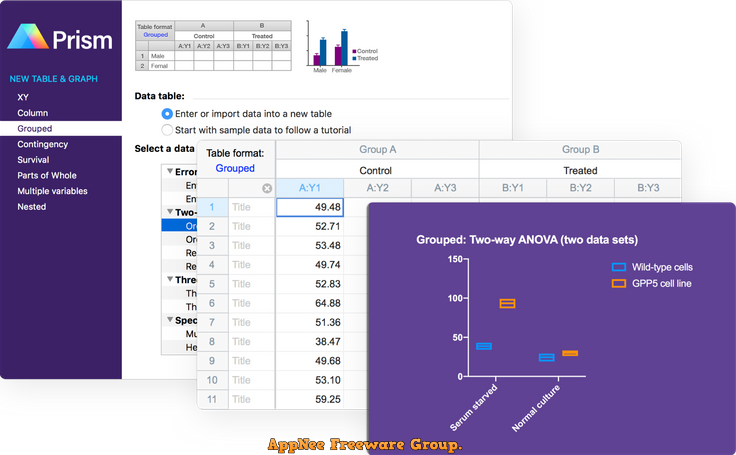
GraphPad Prism offers a diverse selection of features and tools designed to assist you in systematically organizing your data and conducting thorough statistical analyses. The spreadsheet-like design enables you to visualize your data in an organized fashion while ensuring easy access to all necessary tools.
GraphPad Prism supports various types of analyses, ranging from common methods to more specialized techniques, including linear and nonlinear regressions, ANOVA, binary logistic regression, and T-tests, among others. While it is not exclusively for statisticians, it is essential to have a foundational understanding of the significance of the calculations being performed.
A standout feature of GraphPad Prism is its tailored formatting for the analyses you intend to conduct. Whether you're dealing with quantitative or qualitative data, the application provides several templates to help you start off on the right foot, ensuring data entry accuracy and selection of the appropriate analyses and graphs.
Overall, GraphPad Prism is an excellent resource for anyone managing scientific data. It not only enables comprehensive and precise analyses, but also offers tools to verify the integrity of the results by allowing you to retrace each step of the analysis process.
Key Features
| Feature | Description |
| Organize Your Data Effectively | Prism is specifically formatted for the analyses you want to run, including analysis of quantitative and categorical data. This makes it easier to enter data correctly, choose suitable analyses, and create stunning graphs. |
| Sample Size and Power Analysis | Optimize your experiments from the start by accurately determining the necessary sample size for your predicted effect, or investigate the smallest effect you can detect given a limited sample size. Streamline your research process, conserve valuable resources, and boost the reliability of your findings. |
| Perform The Right Analysis | Avoid statistical jargon. In clear language, Prism presents an extensive library of analyses from common to highly specific— t tests, one-, two- and three-way ANOVA,linear and nonlinear regression dose-response curves, binary logistic regression, survival analysis, principal component analysis, and much more. Each analysis has a checklist to help you understand the required statistical assumptions and confirm you have selected an appropriate test. |
| Get Actionable Help As You Go | Reduce the complexity of statistics. Prism’s online help goes beyond your expectations. At almost every step, access thousands of pages from the Prism User Guides. Learn from video lessons, guides and educational materials through Prism Academy. Browse the Graph Portfolio and learn how to make a wide range of graph types. Tutorial data sets also help you understand why you should perform certain analyses and how to interpret your results. |
| One-Click Regression Analysis | No other program simplifies curve fitting like Prism. Select an equation and Prism does the rest—fits the curve, displays a table of results and function parameters, draws the curve on the graph, and interpolates unknown values. |
| Focus on Your Research, Not Your Software | Prism handles the coding for you. Graphs and results are automatically updated in real time. Any changes to the data and analyses— direct entry of data, omitting erroneous data, correcting typos, or changing analysis choices—are reflected in results, graphs, and layouts instantaneously. |
| Automate Your Work Without Programming | Automatically add multiple pairwise comparisons to your analysis with a single click. For customization options of these lines and asterisks, simply click the toolbar button again. Make adjustments to the data or the analysis, and the results displayed on the graph will update automatically. |
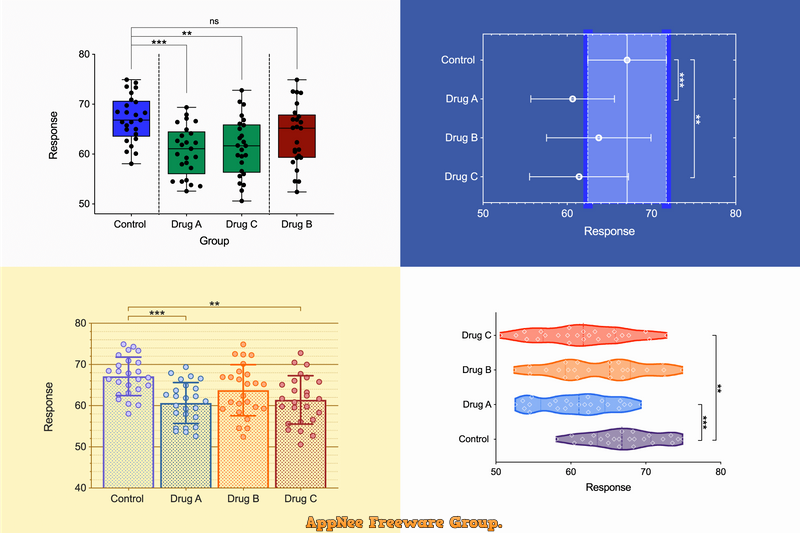
| Countless Ways to Customize Your Graphs | Explore countless ways to present a single data set. Select the visualization style that most clearly tells the story contained within your data. Simply choose a graph type, then customize it in real-time with changes to how the data are arranged, the style of the data points, labels, fonts, colors, and much more. The customization options are endless. |
| Explore Your Data | Focus your efforts on analyzing the most relevant data. Customize how you present the relationships in the data to effectively explore large data sets. Notice something interesting? Highlight a single data point to explore its corresponding properties. With Prisms' robust data wrangling capabilities, you can both save time and ensure that your analysis is based on clean and well-structured data. |
| Export Publication-Quality Graphs With One Click | Reduce time to publish. Prism allows you to customize your exports (file type, resolution, transparency, dimensions, color space RGB/CMYK) to meet the requirements of journals. Set your defaults to save time. |
| Collaboration. Simplified. | Avoid those messy email threads and use Prism Cloud to share, view and collaborate on your Prism projects. Safeguard the interoperability and reusability of your results with Prism’s open access file format. By using industry-standard formats (CSV, PNG, JSON, etc.), you can ensure that your projects can be utilized outside of Prism to open up new possibilities for your data workflows and integrations. |
Edition Statement
AppNee provides the GraphPad Prism multilingual full installers, unlocked files and keygens for Windows 32-bit and 64-bit, as well as pre-activated versions for Mac.Installation Notes
for v10.4.0 on Windows:- Disable your Internet connection temporarily
- Install GraphPad Prism
- Run "shell:startup", copy the unlock patch to this folder, and run it (it is required to use GraphPad Prism in offline mode)
- Run keygen as administrator, click 'Patch HOSTS' or add the following lines to your hosts file:
- 127.0.0.1 licenses.graphpad.com
- 127.0.0.1 isul.graphpad.com
- Run program, and go to activation
- Go back to keygen, click 'Make Serial Number', and copy it to program to continue
- Copy "Machine ID" to keygen, and click 'MakeActivation Code'
- Copy the activation code to program to complete the activation process
- Done
- Download and install GraphPad Prism
- Copy the unlocked file to installation folder and overwrite
- Add the following lines to your hosts file:
- 127.0.0.1 licenses.graphpad.com
- 127.0.0.1 isul.graphpad.com
- Use the keygen to register program
- Done
Warning
The keygen might be reported as Win32:Evo-gen [Trj] threat with high risk. Use VirusTotal to make a full, authoritative scan, and decide to use it or not by yourself.*** Please remember: antivirus software is not always right, just be careful and use it at your own risk.
Related Links
Download URLs
| Version | Download | Size |
| for Windows | ||
| v10.4.0 |  |
255 MB |
| for Mac | ||
| v10.3.1 |  |
111 MB |