#5563
Minitab is the unmatched, all-in-one data analysis and statistics software for everyone that lets data be used for what it is worth. It is not only a leader in providing statistical software and services for quality improvement, education and research applications, but also a world-leading software tool for quality management and Six Sigma implementation, as well as a good tool for continuous quality improvement. It can analyze data to identify problems and meaningful solutions when users encounter the most intractable business problems.
Loading...
Loading...
Loading...
Loading...
Loading...
Loading...
Loading...
#5480
Maple is a general-purpose commercial computer algebra system (symbolic computing environment + numeric computing environment + multi-paradigm programming language) developed by Maplesoft (Waterloo Maple) from Canada in 1982. It is known as one of the three major mathematical software programs along with MATLAB and Mathematica, and its main competitor should be Mathematica
Loading...
Loading...
Loading...
Loading...
Loading...
Loading...
Loading...
Loading...
#5224
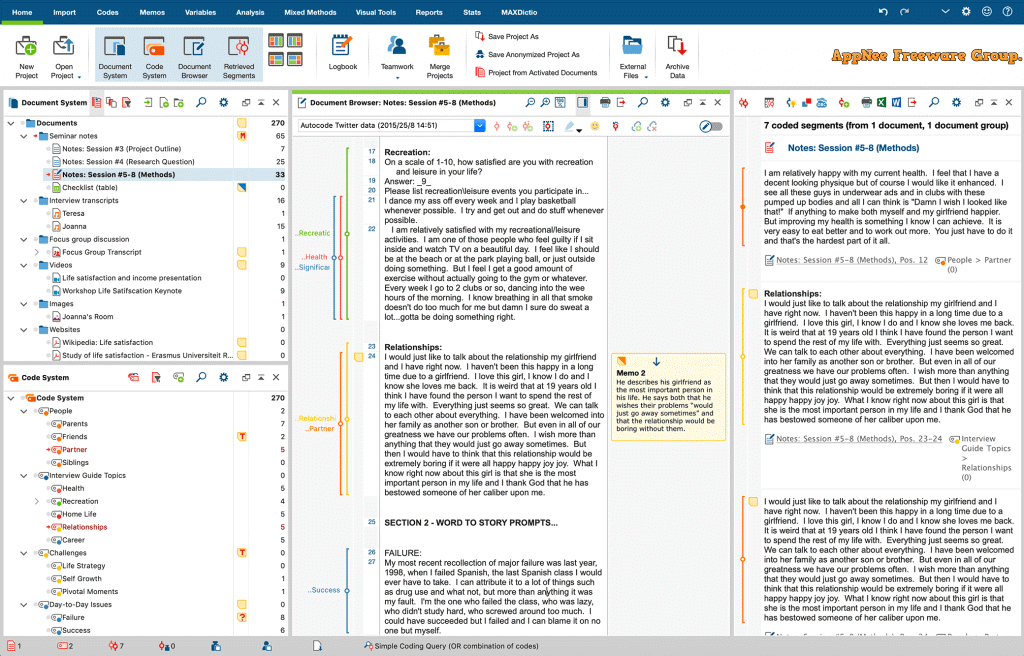
As a matter of fact, qualitative analysis is less dependent on software than numerical analysis. Although software brings great convenience, it can also hinder people's thinking ability, even the actual effect is not as good as the traditional pen & paper operation. Anyway, there have been a lot of QDA (Qualitative Data Analysis) software in the market, but only three of them are the most popular ones: ATLAS.ti, NVivo and MAXQDA. By contrast, MAXQDA's user interface is friendly, supports Unicode encoding, has a very small file size (only dozens of MBs), and runs fast.
Loading...
Loading...
Loading...
Loading...
#5214
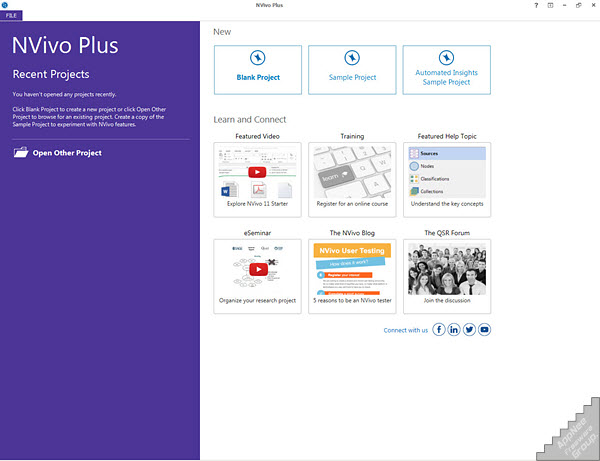
NVivo (short for Nudist Vivo) is a very powerful qualitative data research and analysis software, developed by QSR International from Australia in 1999. Through node, coding and qualitative methods, it completes the leach and extraction of documents in different formats, and collates, analyzes and shares data for users.
Loading...
Loading...
Loading...
Loading...
Loading...
Loading...
Loading...
#4442
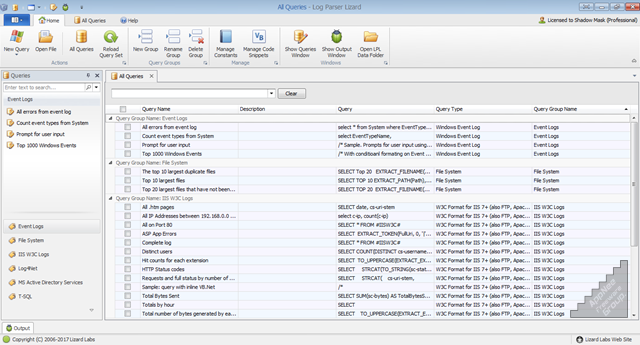
The operation and maintenance of websites or web services can't do without checking and analyzing the server logs. For this, many webmasters or administrators may have the very powerful and professional log analyzing tool from Microsoft - logparser (AKA: Log Parser, Microsoft Logparser) in mind. But Microsoft Logparser's command line interface can be a daunting challenge for many non-professional managers. Thereupon, some enhanced GUI tools for Microsoft Logparser such like Visual Log Parser GUI, Log Parser Lizard appeared.
Loading...
Loading...
Loading...
Loading...
Loading...
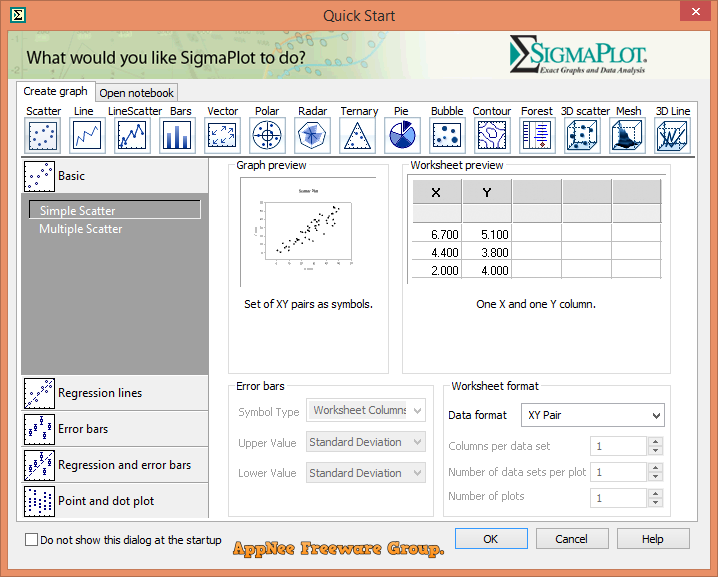
#3975
If you often publish technological articles and papers, and have lots of data to be converted to 2D (x, y axis) or 3D (x, y, z axis) of graphics, then SigmaPlot can save you a lot of time and expensive manual work. It can help users quickly and clearly draw accurate, high-quality 2D/3D charts. At the same time, it also comes with powerful data statistics and analysis capabilities that can serve in many fields
Loading...
Loading...
Loading...
Loading...
Loading...
Loading...
#3946
Tableau Desktop is a famous and very powerful data analysis & visualization leader. In addition to professional technology, more importantly, it's a foolproof tool that can make externalization and visualization process to complex data, so that ordinary users are able to easily show their complex data in hand in a professional way with all sorts of graphs.
Loading...
Loading...
Loading...
Loading...
Loading...