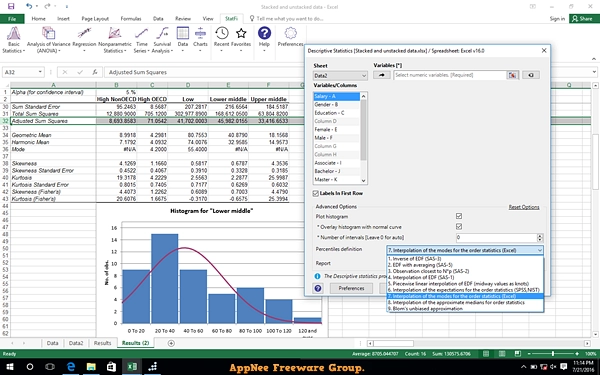
StatPlus (formerly called BioStat) is a robust set of statistical tools, complemented by visually appealing graphical data analysis methods. It turns raw numbers into meaningful insights. Even if you are a beginner and the world of statistics seems incomprehensible to you, this program is designed to be convenient and understandable.
One of the distinctive features of StatPlus is its tight integration with Excel using the StatFi add-on. If you're familiar with Excel, you're in luck - this means you can use a familiar environment while gaining advanced statistical capabilities. No more need to switch from one tool to another. It not only analyzes data, but also helps prepare it. You can easily convert and sample data, creating the basis for accurate and meaningful analysis. From regression analysis to nonparametric methods and even survival analysis, StatPlus is like an all-in-one tool for data analysts. No matter what industry you work in, this tool meets a wide range of needs.
If you work in healthcare, finance, education, or any other industry that requires data interpretation, StatPlus will be helpful. To work with it, you don't need to be a specialist in statistics. Thanks to its user-friendly interface and easy integration with such a well-known platform as Excel, even a novice user can figure it out.
In short, StatPlus features ease of use, integration with Excel, and a large set of tools for from data sampling to advanced statistical analysis. So, if you are still looking for a universal solution that will allow you to speed up the process of data analysis and not get confused in the intricacies of statistics, then StatPlus will help you.
Key Features
| Feature |
Description |
| Pro Features |
- Fast and powerful standalone spreadsheet.
- Add-in for Excel 2007, 2010, 2013, 2016, 2019 and 2021.
- Priority support.
- Permanent license with free major upgrades during the maintenance period.
- Options to emulate Excel Analysis ToolPak results and migration guide for users switching from Analysis ToolPak.
|
| Basic Statistics |
- Detailed descriptive statistics.
- One-sample t-test.
- Two-sample t-test.
- Two-sample t-test for summarized data.
- Fisher F-test.
- One-sample and two-sample z-tests.
- Correlation analysis and covariance.
- Normality tests (Jarque-Bera, Shapiro-Wilk, Shapiro-Francia, Cramer-von Mises, Anderson-Darling, Kolmogorov-Smirnov, D'Agostino's tests).
- Cross-tabulation and Chi-square.
- Frequency tables analysis (for discrete and continuous variables).
- Multiple definitions for computing quantile statistics.
|
| Analysis of Variance (ANOVA) |
- One-way and two-way ANOVA (with and without replications).
- Three-way analysis of variance.
- Post-hoc comparisons - Bonferroni, Tukey-Kramer, Tukey B, Tukey HSD, Neuman-Keuls, Dunnett.
- Within subjects ANOVA and mixed models.
|
| Multivariate Analysis |
- Principal component analysis (PCA).
- Factor analysis (FA).
- Discriminant function analysis.
- Hierarchical Clustering and K-Means.
|
| Nonparametric Statistics |
- 2x2 tables analysis (Chi-square, Yates Chi-square, Exact Fisher Test, etc.).
- Rank and percentile.
- Chi-square test.
- Rank correlations (Kendall Tau, Spearman R, Gamma, Fechner).
- Comparing independent samples
- Mann-Whitney U Test, Kolmogorov-Smirnov test, Wald-Wolfowitz Runs Test, Rosenbaum Criterion. Kruskal-Wallis ANOVA and Median test.
- Comparing dependent samples
- Wilcoxon Matched Pairs Test, Sign Test, Friedman ANOVA, Kendall's W (coefficient of concordance).
- Cochran's Q Test.
|
| Regression Analysis |
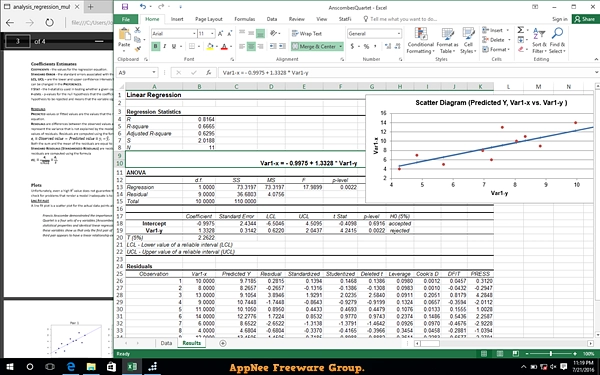
- Multivariate linear regression (residuals analysis, collinearity diagnostics, confidence and prediction bands).
- Weighted least squares (WLS) regression.
- Logistic regression.
- Stepwise (forward and backward) regression.
- Polynomial regression.
- Curve fitting.
- Tests for heteroscedasticity: Breusch–Pagan test (BPG), Harvey test, Glejser test, Engle's ARCH test (Lagrange multiplier) and White test.
|
| Time Series Analysis |
- Data processing.
- Fourier analysis.
- Smoothing.
- Moving average.
- Analysis.
- Autocorrelation (ACF and PACF).
- Interrupted time series analysis.
- Unit root tests - Dickey–Fuller, Augmented Dickey–Fuller (ADF test), Phillips–Perron (PP test), Kwiatkowski–Phillips–Schmidt–Shin (KPSS test).
|
| Survival Analysis |
- Life tables.
- Kaplan-Meier (log rank test, hazard ratios).
- Cox proportional-hazards regression.
- Probit-analysis (Finney and LPM).
- LD values (LD50/ED50 and others), cumulative coefficient calculation.
- Receiver operating characteristic curves analysis (ROC analysis).
- AUC methods - DeLong's, Hanley and McNeil's. Report includes: AUC (with confidence intervals), curve coordinates, performance indicators - sensitivity and specificity (with confidence intervals), accuracy, positive and negative predictive values, Youden's J (Youden's index), Precision-Recall plot.
- Comparing ROC curves.
|
| Data Processing |
- Sampling (random, periodic, conditional).
- Random numbers generation.
- Standardization.
- Stack/unstack operations.
- Matrix operations.
|
| Statistical Charts |
- Histogram.
- Scatterplot.
- Box plot.
- Stem-and-leaf plot.
- Bland-Altman plot.
- Bland-Altman plot with multiple measurements per subject.
- Quantile-quantile Q-Q plots for different distributions.
- Control charts - X-bar, R-chart, S-chart, IMR-chart, P-chart, C-chart, U-chart, CUSUM-chart.
|
System Requirements
Edition Statement
AppNee provides the StatPlus Pro Edition multilingual full installers and unlocked files for Windows 32-bit and 64-bit.
Installation Notes
for v7.7.0 on Windows:
- Download and install StatPlus
- Copy the unlocked file to installation folder and overwrite:
- C:\Users\[user name]\AppData\Roaming\StatPlus6\
- Done
Download URLs
| License |
Version |
Download |
Size |
| for Windows |
| Pro Edition |
v7.7.0 |
 |
96.0 MB |
(Homepage)